
Did YouTube's New View Count Inflate Views? 3,565 Channels
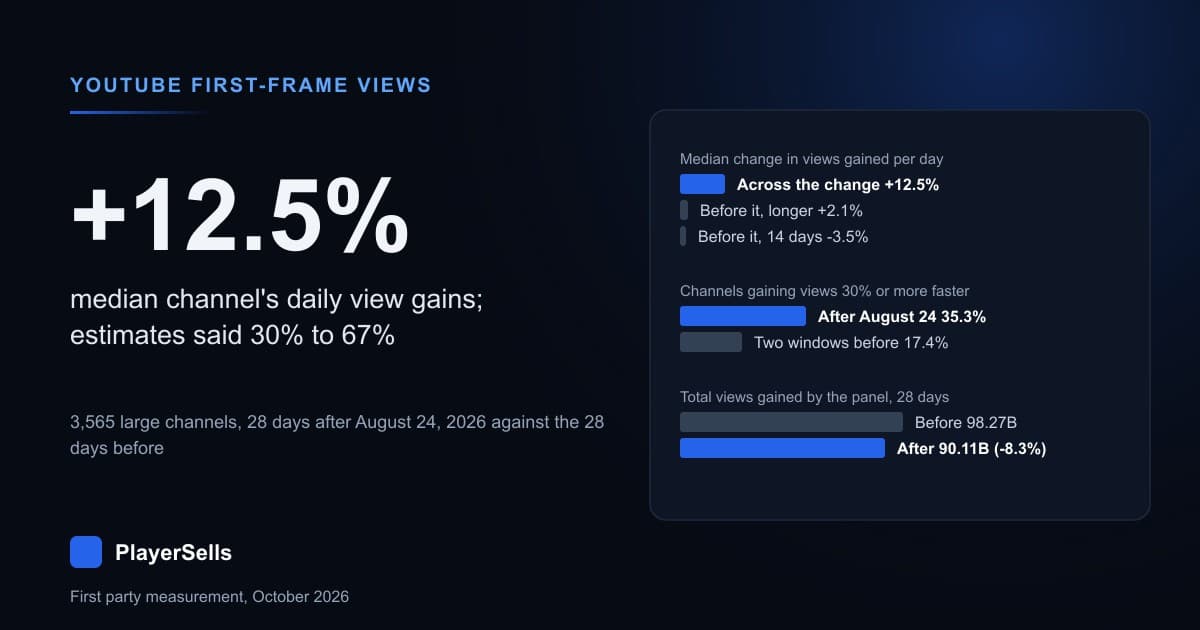
After YouTube began counting views from the first frame on Aug 24, 2026, the median large channel gained public views 12.5% faster. 3,565 channels measured.
A little, and much less than the early estimates suggested. YouTube began counting a view from the first frame of playback on August 24, 2026. In the four weeks that followed, the median channel in our panel of 3,565 large YouTube channels gained public views 12.5% faster than in the four weeks before. Two comparisons made entirely before the change moved -3.5% and +2.1%, so the new count lines up with a rise of roughly 10.4 to 16.0 percentage points for the typical channel, not the 30% projected for long-form videos or the 67% that a 60% engaged view rate implies. Added together, the same channels gained 8.3% fewer views after the change than before, because the biggest channels slowed.
The figures come from PlayerSells' YouTube directory, which reads the public view counter of every channel it tracks through YouTube's Data API each day; we checked that this counter is the sum of the channel's public video view counts and matches the number on the watch page. YouTube's announcement says that starting August 24, 2026, "views across YouTube are counted from the first frame going forward" for Shorts, long-form videos, podcasts and live streams. The old measure is now called an engaged view and, as TechCrunch's Aisha Malik reported on August 17, 2026, stays visible to creators in YouTube's analytics tools. Agentio, a creator advertising platform, projected on August 21 that long-form public views would run about 30% above engaged views, using 35,800 videos and an assumed 30-second threshold. On September 3 it reported a 60% engaged view rate across 75,000+ videos published since June 1, and wrote that a new video "can look 67% larger" than an identical one posted before. Those figures compare public and engaged views on the same plays. We compare the public counter of the same channels before and after the change, which is the number viewers, brands and buyers actually see.
Key findings, July 6 to October 19, 2026
- 3,565 YouTube channels with 1,440,000 or more subscribers on August 24 (median 3,080,000), each read every day from July 27 to September 21, 2026.
- The median channel gained public views 12.5% faster in the 28 days after August 24 than in the 28 days before (+14.1% when fitting a daily trend); 64.0% of channels gained faster.
- Before the change, the same kind of comparison moved -3.5% (two 14-day windows) and +2.1% (July 6 to 27 against July 27 to August 24).
- 35.3% of channels gained views at least 30% faster across the change, against 17.4% in the longer comparison before it; 17.4% gained at least 67% faster, against 7.2%.
- Smaller channels moved more: +16.8% for the median channel under 3 million subscribers, +6.7% at 10 million and up.
- The panel's total views gained fell 8.3%, from 98.27 billion to 90.11 billion, as the largest channels slowed. In the second month (September 21 to October 19) the total was +3.0% against the pre-change window and the median channel +12.0%.
Did public view counts jump after August 24?
For the typical channel they rose, but not by much. We took each channel's public view counter and compared the views it gained per day in the 28 days after August 24, 2026 with the 28 days before. The median channel gained 12.5% faster, the middle half of channels fell between -9.5% and +46.8%, and 64.0% of channels sped up while 36.0% slowed down. Fitting a straight line through every daily reading instead of using the two end points gives +14.1%. Channel views drift from month to month for ordinary reasons, so we ran the same comparison on windows that sit entirely before the change: the median moved -3.5% between two 14-day windows and +2.1% between July 6 to 27 and July 27 to August 24. Only the comparisons that cross August 24 rose by about ten points or more.
| Comparison | Windows, 2026 | Channels | Median change in views gained per day | Middle half of channels | Channels that gained faster | Change in total views gained |
|---|---|---|---|---|---|---|
| Across the change | July 27 to August 24, against August 24 to September 21 | 3,565 | +12.5% | -9.5% to +46.8% | 64.0% | -8.3% |
| Across the change, daily trend fit | same 28-day windows, least squares slope | 3,558 | +14.1% | -8.7% to +51.7% | 64.9% | -6.7% |
| Across the change, 14 days | August 10 to 24, against August 24 to September 7 | 3,553 | +9.3% | -8.7% to +33.4% | 63.7% | -14.6% |
| Before the change, 14 days | July 27 to August 10, against August 10 to 24 | 3,499 | -3.5% | -16.3% to +9.5% | 40.9% | -12.4% |
| Before the change, longer | July 6 to 27, against July 27 to August 24 | 3,547 | +2.1% | -13.0% to +18.4% | 53.8% | +1.6% |
| After the change, 14 days | August 24 to September 7, against September 7 to 21 | 3,566 | +4.6% | -11.0% to +34.9% | 57.7% | +2.4% |
| Second month | July 27 to August 24, against September 21 to October 19 | 3,564 | +12.0% | -13.9% to +53.2% | 62.2% | +3.0% |
Same channels compared with themselves: views gained per day in the later window divided by views gained per day in the earlier one. Public channel view counters read daily through the YouTube Data API. Channels that gained no views in the earlier window are left out (116 in the main comparison). The longer pre-change comparison uses 3,547 channels that were also read every day from July 6.
How does this compare with the 30% and 67% estimates?
It is well below both, but the estimates measure something narrower. Agentio's 30% is a projection for long-form videos made before the change. Its 60% engaged view rate covers views after August 24 on videos published since June 1, and on its own numbers (549 million public views, 330 million engaged) public views ran about two thirds above engaged views. If every view on our channels had been lifted that much, the median channel would have gained views 30% to 67% faster. Some did: 35.3% of channels gained at least 30% faster across the change, but 17.4% also did in the comparison of two pre-change windows, and 17.4% gained at least 67% faster against 7.2% before.
Three things could close the gap, and our data cannot tell them apart. Shorts were already counted from the first frame: TechCrunch noted that the change "comes a year after YouTube applied the same approach to counting views on Shorts videos", so a channel whose views come mostly from Shorts should barely move. Views on older catalogue videos may start differently from views on new uploads, which is what Agentio measured. And the old public count may not have matched what YouTube now reports as an engaged view exactly.
When did the rise show up?
In the week after the change, though single weeks are noisy. The median channel's seven days to August 24 were -5.4% against its own average pre-change week, and its seven days to August 31 were +7.2%. From then on, every week through October 18 was above the pre-change pace for the median channel. Single weeks swing by more than 20% in both directions because YouTube's public counters sometimes stop updating for a day and then catch up: on August 2, 97.9% of the panel's counters did not move at all, and on September 4, 72.8%. That is why the comparisons above use 14 and 28 days.
| Week starting (2026) | Median channel, change against its own average week before August 24 | Channels above their pre-change pace | Total views gained, billions |
|---|---|---|---|
| July 27 | -22.6% | 29.5% | 19.73 |
| August 3 | +21.5% | 66.6% | 26.80 |
| August 10 | -0.4% | 48.9% | 26.93 |
| August 17 | -5.4% | 36.3% | 24.76 |
| August 24 | +7.2% | 61.5% | 22.14 |
| August 31 | +4.5% | 54.7% | 22.94 |
| September 7 | +23.5% | 69.2% | 26.26 |
| September 14 | +5.8% | 54.9% | 18.75 |
| September 21 | +5.7% | 55.4% | 22.84 |
| September 28 | +20.7% | 68.4% | 31.03 |
| October 5 | +8.3% | 57.2% | 24.04 |
| October 12 | +8.2% | 56.7% | 23.22 |
3,564 channels read every day from July 27 to October 19, 2026. Each channel's weekly gain is divided by its average weekly gain from July 27 to August 24, so the first four weeks average out near zero by construction.
Did small and large channels change the same way?
No: the smaller the channel, the larger the rise. The median channel with under 3 million subscribers gained views 16.8% faster across the change, against 9.1% from 3 million to 10 million and 6.7% at 10 million and up. Agentio's projection pointed the same way, with a larger lift for smaller channels, though its size groups are based on a channel's typical monthly views, not subscribers. In total views gained, each size group fell, and the largest fell most (-10.6%).
| Subscribers on August 24, 2026 | Channels | Median change in views gained per day | Channels that gained faster | Channels at least 30% faster | Change in total views gained |
|---|---|---|---|---|---|
| under 3 million | 1,733 | +16.8% | 67.9% | 39.2% | -2.7% |
| 3 million to 10 million | 1,382 | +9.1% | 60.7% | 33.8% | -7.4% |
| 10 million and up | 450 | +6.7% | 58.7% | 24.9% | -10.6% |
July 27 to August 24 against August 24 to September 21, 2026, same channels. The smallest channel in the panel had 1,440,000 subscribers on August 24.
Which kinds of channels moved most?
Business, gaming and film channels moved most, and music least. The median business channel gained views 22.2% faster across the change, gaming 16.1% and movies 15.9%, while education was +5.9% and music +4.1%. English-language channels rose more than the rest (+14.8% against +8.0%). Topic labels come from our own directory, and 1,601 channels have none. We cannot see what share of each channel's views comes from Shorts, so these differences cannot be used to test the Shorts explanation directly.
| Channel topic or language | Channels | Median change in views gained per day | Channels that gained faster | Change in total views gained |
|---|---|---|---|---|
| Business | 214 | +22.2% | 71.0% | +27.9% |
| Gaming | 282 | +16.1% | 67.4% | -1.8% |
| Movies | 222 | +15.9% | 68.5% | +1.2% |
| Memes | 116 | +13.4% | 62.1% | +2.2% |
| Unlabeled | 1,601 | +8.3% | 61.2% | -11.9% |
| Education | 268 | +5.9% | 58.2% | -26.7% |
| Music | 392 | +4.1% | 56.9% | -22.5% |
| English | 2,316 | +14.8% | 65.8% | -10.9% |
| Other or unknown | 1,249 | +8.0% | 60.4% | -2.9% |
July 27 to August 24 against August 24 to September 21, 2026. Topics with at least 80 channels in the panel. Language is the channel's main language in our directory.
Why did total views fall while the typical channel rose?
Because the biggest channels slowed in late August and September, and they hold most of the views. The 3,565 channels together gained 98.27 billion public views in the four weeks before August 24 and 90.11 billion in the four weeks after, a fall of 8.3%. In total, channels with 10 million or more subscribers fell 10.6%, music channels 22.5% and education channels 26.7%. It was not one or two channels: the ten with the most views before the change held 13.0% of the total and fell 9.4%, and without them the total still fell 8.1%. In the second month the total recovered to +3.0% against the pre-change window. We have no 2025 readings for these channels, so we cannot say how much of the slowdown is seasonal.
Is the channel counter the same number viewers see?
Yes. On October 23, 2026 we read, for each of 47 channels and in one pass of a few seconds, the channel's public view counter and the view count of every video in its uploads. For the 25 channels where every upload could be read, the videos added up to a median 1.0003 times the channel counter, and 24 of 25 were within 2%. These channels had gained a median 11.1% of their lifetime views since August 24, so if the channel counter had kept the old rule while video counters moved to first-frame views, the videos would add up to about 1.0333 to 1.0741 times the channel counter. We also compared the Data API view count of 18 recent videos with the number on their public watch pages: 10 matched exactly and the largest gap was 0.67%, consistent with views added between the two reads.
What does this mean for anyone comparing YouTube views?
Views gained since August 24, 2026 are not on the same scale as views gained before, and a lifetime total now mixes both. For the median large channel in our panel the difference in views gained per day was roughly 10.4 to 16.0 percentage points; for about a third of channels the rise was 30% or more. A brand reading a creator's last 30 days against the summer, or a buyer comparing a channel's monthly views across August, is comparing two counting rules. Engaged views, which follow the old definition, are the measure that stays comparable, and creators can see them in YouTube's analytics.
How we measured
Data. PlayerSells' YouTube directory reads the public statistics of the channels it tracks through the YouTube Data API and keeps one view counter reading per channel per day. The panel is every channel with at least 20 daily readings before August 24, 2026 (5,981 channels) and a reading on every day from July 27 to September 21, 2026: 3,681 channels and 209,817 daily readings. The queries ran on October 23, 2026.
Measure. For each channel, views gained per day in a window is the counter at the end minus the counter at the start, divided by the number of days. The channel's change is the later window over the earlier one; we report the median across channels, the 25th to 75th percentile range as the middle half, and the change in the sum across channels as the total. The trend variant uses the least squares slope of the daily counter in each window. Channels with no views gained in the earlier window are left out.
Comparisons. The main comparison is 28 days on each side of August 24. To see how much views drift without a counting change, we ran the same calculation on windows entirely before August 24 (two 14-day windows, and July 6 to 27 against July 27 to August 24) and entirely after it. The weekly table divides each channel's weekly gain by its average week from July 27 to August 24.
Instrument check. For channels that gained a large share of their lifetime views after August 24 and have at most a few hundred uploads, we read the channel counter and every upload's public view count through the same API in one pass, and the channel counter again at the end; channels whose counter moved during the read, or whose uploads could not all be read, were left out.
Open data. The aggregate tables are in our open data repository as youtube-view-count-change-2026-10 (CC BY 4.0).
Limitations
- Large channels only. Every channel in the panel had at least 1,440,000 subscribers. Our daily readings follow big channels; small creators may have seen a different change.
- No previous year. We have no 2025 readings for these channels, so late-summer and September seasonality cannot be fully separated from the counting change. The pre-change comparisons cover July and August only.
- Formats mixed. The channel counter adds up long-form videos, Shorts, live streams and podcasts. We cannot see the change for each format or each video.
- Public counters only. We do not see engaged views, watch time or how many people watched. YouTube also removes views it judges invalid, which can lower a counter.
- Counter pauses. Public counters sometimes stop updating for a day and catch up later, which makes single days and weeks noisy; the conclusions rest on 14 and 28-day windows.
- Topic labels. Topics come from our own classification and 1,601 channels in the panel have no label.
Frequently asked questions
Did YouTube views go up after August 24, 2026?
Modestly, for large channels. Across 3,565 channels with 1,440,000 or more subscribers, the median channel gained public views 12.5% faster in the 28 days after August 24 than in the 28 days before, against -3.5% and +2.1% in comparisons made before the change. The panel's total views gained fell 8.3%.
What is an engaged view on YouTube?
It is the name YouTube now gives to its previous definition of a view. Since August 24, 2026 the public view count starts at the first frame of playback, and the old measure stays available to creators as engaged views in YouTube's analytics.
Are YouTube view counts before and after August 24 comparable?
Not directly. Views gained since August 24 follow the first-frame rule and earlier totals were left as they were. In our panel the median channel's daily view gains rose 12.5% across the change, and about a third of channels rose 30% or more, so month-on-month comparisons across August mix two rules.
Did the change affect Shorts?
YouTube's announcement lists Shorts among the formats counted from the first frame, but TechCrunch reported that Shorts views were already counted this way a year earlier. Our channel counters mix all formats, so we cannot measure Shorts separately.
To look up a single channel, use the YouTube subscriber rank tool or the YouTube channel rankings, built from the same directory; the YouTube channel value estimator shows why view history matters when a channel changes hands. Our earlier YouTube measurements cover subscriber growth rates and how channel size relates to price, and every data report we publish is listed on our open data page.
Free tools for this topic

Published by the PlayerSells editorial team. Data comes from PlayerSells marketplace records and our own crawlers. About PlayerSells · Editorial policy
Related Articles
Continue learning with these related guides.

Do Streamers Keep Simulcasting? 10,328 Tracked for 4 Weeks
Week to week, 42.3% of Kick and Twitch simulcasters stop. Of 10,328 streamers tracked for four weeks, 49.3% did it in one week, 15.4% in all four.

YouTube Automation and Inauthentic Content: Buyer Risks
Is YouTube automation legit? Yes, but YouTube won't monetize mass-produced content. See the inauthentic content rule and how to vet a channel before buying.

Valorant Rank Distribution: Percentages and Account Value
Valorant rank distribution for V26 Act 6: Gold is 21.93% of players, Immortal+ about the top 1-2%. See how rank rarity affects account value and ban risk.